Year in pixels: the grid that shows you a whole year of days
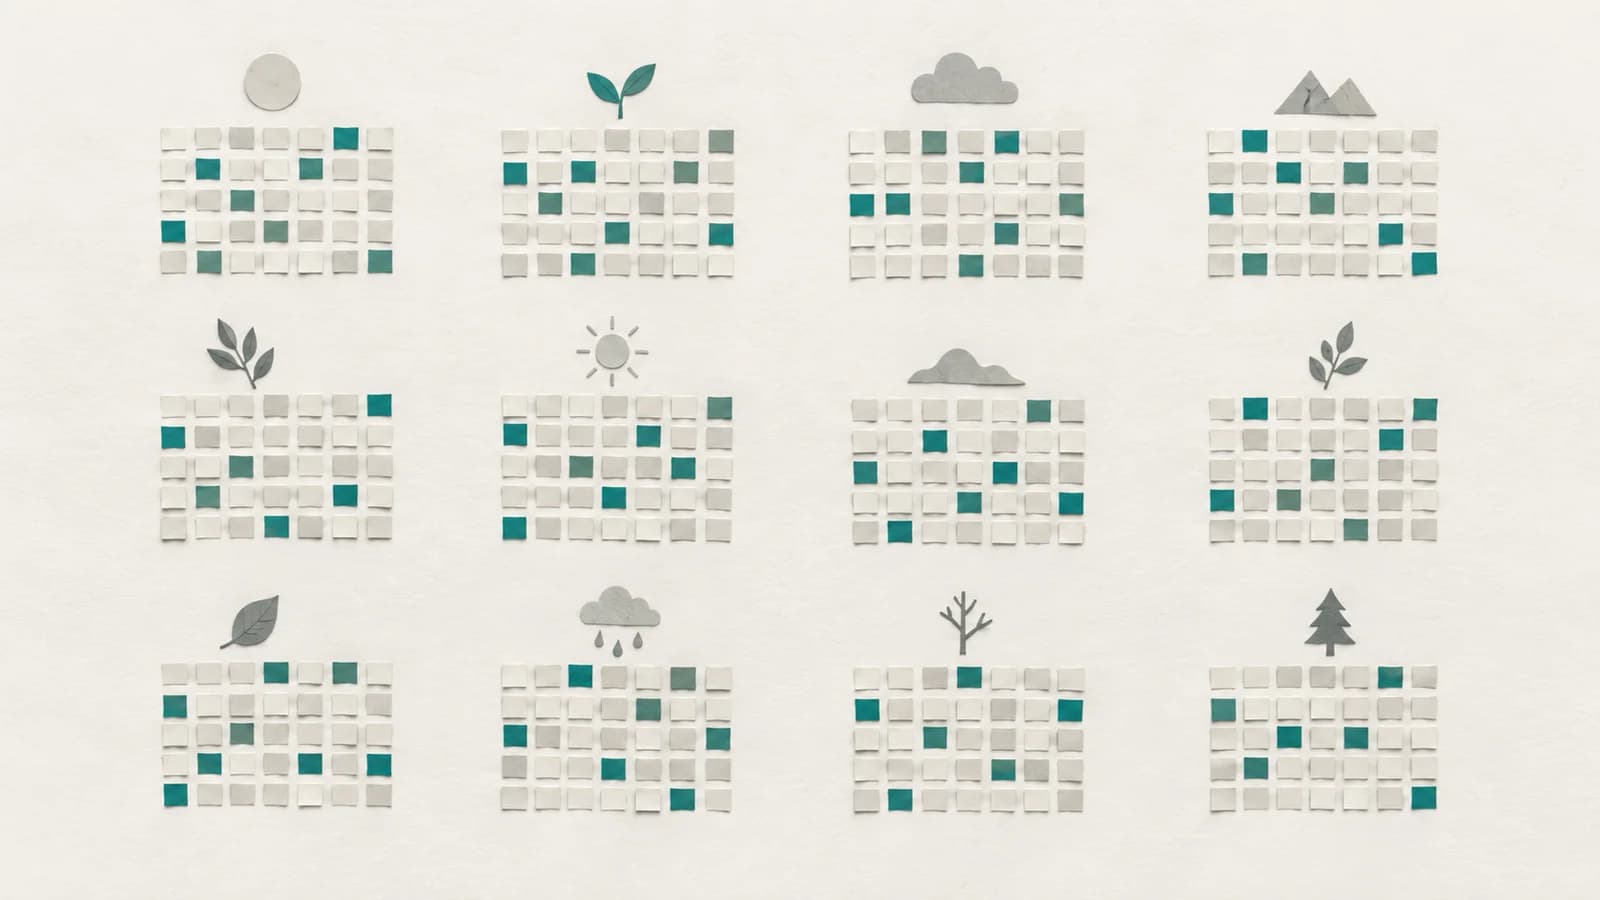
A year of your life fits on one page. Twelve columns of thirty one rows, the cells for days that do not exist crossed out, leaving three hundred and sixty five small squares, one of them filled in every evening. By December you are holding something you cannot get any other way: the shape of a whole year, drawn while you were still close enough to remember what each day was.
That is a year in pixels. It came out of the bullet journal community as a personal notebook spread: a ruled grid of one cell per day, each cell coloured by how the day had gone. From there the idea spread into printable templates, planner shops and a handful of phone apps. A good number of the people who copied it stopped in March.
This post covers both halves of that. How to draw the grid so it survives the first six weeks, why a key with five colours reads better in July than one with twelve, and how to look at the finished year without turning it into a verdict on yourself. Then the digital versions, described as they actually are, including what the grid in Loggd is and what it is not.
What a year in pixels is
The layout is a rectangle. One column per month across the top, one row per day down the side, so the grid is twelve wide and thirty one deep. Every cell is one day of the year. Underneath sits a key of four to six colours, each standing for a kind of day. In the evening you find today's cell and fill it in.
There is no writing anywhere in the practice, and that is the constraint that makes it last. A journal page asks you to have something to say. A cell asks you to pick a colour, which you can do at 11 pm on a day you would rather not describe. The version of the ritual you will still be doing in August is the one that costs eight seconds.
What you get in exchange for those eight seconds is scale. A single day tells you nothing. A week is mostly noise. Three hundred days of cells sitting next to each other is a picture of a year that no amount of remembering will reproduce, because your memory of March is one strong day and a mood, and the grid has all thirty one.
How to make one on paper
The whole practice is five decisions and about twenty minutes of ruling. Make the decisions before January rather than during it, because a grid you are still designing in week three is a grid you will stop filling in week four.
Rule the grid before you need it
Dot grid or graph paper makes this trivial: count out squares rather than measuring. Two dot-grid squares per cell is the usual size, laid across a double page so there is room for the key underneath. Draw all twelve columns now, including the months you have not reached, and label them. February, April, June, September and November end early, so cross out the cells that do not exist rather than leaving them open to be filled by mistake.
If ruling by hand is the part you will not do, print one. Free templates exist from most of the planner sites, and using one costs nothing except the small pleasure of having drawn it.
Decide what a cell is rating
This is the decision people skip and then regret in February. A cell can rate the whole day taken together, which is what the original notebook spreads did, or it can track one specific thing: your mood, your energy, your pain, how well you slept. Both work. Mixing them does not, because a cell that means "good mood" in January and "good energy" in April cannot be compared to itself.
Write the answer down next to the key in one short phrase. "How the day went overall" is a fine answer. So is "energy at bedtime". What matters is that the January you and the October you are answering the same question.
Pick the moment you fill it in
Attach the cell to something you already do at a fixed time. After you plug the phone in. After you brush your teeth. Before you turn the lamp off. The anchor matters more than the hour, because an anchor that happens every night without a decision is more reliable than a time you have to notice. This is the same mechanism that carries every small daily thing, and if you want it in more detail there is a whole post on staying consistent when motivation is gone.
Fill today's cell and only today's
The rule that keeps the grid honest is that you colour the day you are in, not the days you are reconstructing. A cell filled three days late is a rating of your memory rather than of the day, and once a grid contains a mix of the two you cannot tell which cells are which.
Decide now what a blank means
Missed days will happen, and a grid with no rule for them turns into a small argument every time you open it. Pick one policy and write it under the key. The two that work are "a blank means I did not fill it in" and "a blank means an ordinary day". The first keeps the data clean, the second keeps the page looking finished. Choose whichever one you will not renegotiate in March.
A key you can still read in July
Four to six colours. Fewer than four and the year comes out flat, more than six and you start hesitating at the key instead of choosing, which adds ten seconds to an eight second ritual and is how the habit dies.
A five-level scale that works well runs from "one of the good ones" through "fine" to "hard", with a level at each end for the days that were genuinely unusual. Order the colours so the scale reads as a scale: a warm to cool run, or light to dark in a single hue. Rainbow keys look better on the page and are much harder to read at a glance in December, because your eye cannot rank six unrelated hues without going back to the legend every time.
Two practical notes. If you are colourblind, or you are filling this in by lamplight, add a second signal: a number in the corner of the cell, or a shape, or vary the amount of the cell you fill rather than the hue. And pick colours you own in a pen you like, since a key that needs a specific marker you have to find is a key that gets skipped.
Resist the urge to add a colour mid-year. The whole value of the grid is that the cells are comparable, and a sixth colour introduced in July splits your year into two datasets that only look like one.
What a year of cells shows that a month does not
Three things reliably appear at year scale and at no smaller scale.
The first is the weekday shape. Read the grid across rather than down and you may find that a particular day of the week is consistently your worst, which is not something anybody notices from the inside. It usually has a dull cause: the day with two meetings stacked at the end, the evening you get home late, the night you sleep badly because of what happens the following morning. A dull cause is good news, because dull causes are the ones you can move.
The second is season. Light, weather and the shape of your working year leave a visible band. Whether the band is real or whether you were simply expecting it is a fair question, and one the grid does not answer on its own. What it does do is put the question in front of you with three hundred data points attached instead of a feeling.
The third is the fortnight when everything went sideways. Every year has one and nobody remembers when it was. Finding it on the page, and finding what was happening around it, is the single most useful thing this practice does, because a bad fortnight in your memory expands to fill the whole season while on the grid it is fourteen cells with a normal March on either side.
There is a fourth, quieter one. The thing you were certain about turns out to be wrong roughly as often as it turns out to be right. People who are sure Mondays are the problem often find the grid pointing at Wednesday.
Why most grids stop in March
The setup cost is paid once, in January, with January enthusiasm. The running cost is eight seconds a day, which is nothing. Yet the abandoned grids outnumber the finished ones, and the reason is neither of those numbers.
It is the catch-up cost. Miss four days and the next time you open the notebook you are not filling in a cell, you are reconstructing four days you have already half forgotten. That is homework, homework is easy to defer, and a week later it is eleven days. The grid stops because looking at it started to feel like being behind.
There are two ways out and both work. The first is the blank policy you wrote under the key in January: if a blank means "I did not fill it in", then four blanks are four blanks and you colour today and move on. The second is to fill only the days you actually remember, leave the rest empty, and refuse to feel anything about the gap. A year with eleven blank cells is still a year in pixels. A year abandoned in March is not.
The other quiet killer is the grid that has become an exam. If you find yourself trying to earn a good colour, or feeling something when you reach for the darker pen, the practice has turned into a scoring system for your own days. The cell is a record of what happened, and it has no opinion. If it starts having one, take a week off and come back to it, or switch the grid to something with no moral weight at all, like hours of sleep.
Paper, spreadsheet or app
Four honest options, and none of them is best for everyone.
| Option | Setup cost | Best at | Where it fails |
|---|---|---|---|
| Paper grid in a notebook | Twenty minutes of ruling | Being physical, being private, being pleasant to fill | Catch-up after a missed week, and it lives wherever the notebook is |
| Printed template | One print | Getting started tonight with no drawing | Same as paper, plus you did not get to design it |
| Spreadsheet | An hour of conditional formatting | Sorting, counting, comparing years | Nobody opens a spreadsheet at 11 pm |
| Dedicated pixel app | Two minutes | The reminder, and never losing the file | Most are one-purpose, so the year lives away from everything else you track |
A paper grid is the version most people should start with, because the physical object is doing real work: it sits open on the desk and it is not competing with a phone full of other things. A printable template gets you to the same place tonight if the ruling is what stops you. A spreadsheet is the right answer only if you already like spreadsheets, in which case you will build a good one. Dedicated apps, including the several that carry the Year in Pixels name and the wider mood-tracking category, handle the reminder for you and will not lose the file, and the trade is that the year sits in an app you open for nothing else.
Then there is the case where you are already tracking habits and would rather not run a second system. Loggd approaches the same year from the other direction. The home screen is a 365-day grid in the contribution-graph shape, and it is the first thing you see when you open the app rather than a report you go and generate. The cells fill because you checked a habit off that day, so the grid answers what you did rather than how you felt. You do not choose a cell's colour and nothing paints the grid by mood.
The feeling side lives in a separate place: the daily check-in, which is a rating from 1 to 10 and one optional line, once a day. It is one line rather than a page, and it is worth knowing that before you arrive expecting somewhere to write. Kept apart on purpose, the two records answer different questions, and the interesting reading is what happens when you put them next to each other. A week of 4s and 5s sitting directly above a run of empty habit cells tells you the two moved together, and which came first is usually visible on the page: either the ratings dropped and the cells emptied a few days later, or the cells emptied first. There is more on that in the post on the daily check-in, and sixty prompts short enough for a single line in one-line journaling prompts.
One honest caveat if you come to a habit grid from the paper practice. A cell that fills because you did something is a stricter record than a cell you coloured by judgement, and it will feel less forgiving in the first fortnight. That is worth knowing in advance, and it is also the reason the two grids are worth keeping separate rather than merging into one clever colour scheme.
Questions people ask
How many colours should a year in pixels have?
Four to six. Five is the common answer and it holds up: enough range to see a pattern, few enough that you choose without thinking. Order them as a scale rather than as a palette, so the grid can be read at a glance without going back to the key.
What do I do if I miss a week?
Colour today and leave the week blank. Reconstructing days from memory puts a different kind of data in the same grid, and the reconstruction is usually what makes people quit. Blank cells are a legitimate entry, and a year with a few gaps still shows every pattern worth seeing.
Is a year in pixels the same as a mood tracker?
It is one shape of mood tracker, and it can track things other than mood. Plenty of people run one on energy, sleep, pain or how much they wrote. The format is the year on one page with one cell per day, and what the cell measures is your decision.
How long does it take before the grid tells you anything?
About two months before the weekday shape starts to show, and a full year before season means anything. In the first fortnight the grid tells you nothing at all, which is the same shape as most daily practices and one reason people give up early. The post on how long a habit takes covers the same curve for habits.
Can I keep a year in pixels digitally without an app?
Yes. A spreadsheet with twelve columns and thirty one rows plus conditional formatting will do everything the paper version does and sort besides. The only real question is whether you will open it on a Tuesday night, and for most people the honest answer is no.
Start with the ruling. It is the entire setup cost of the paper version and you can pay it in one evening, key included, before the first cell is filled. If you would rather the grid drew itself from things you already track, Loggd fills a 365-day grid from habit check-offs and keeps the 1 to 10 rating in its own field. In March, the cell to look at is not today's. It is the column beside it, where the last four weeks are sitting in a shape you have not seen before.
Read next
60 one-line journaling prompts for a daily check-in
Sixty prompts you can answer honestly in eight words, grouped by whether the day was hard, good, stuck, a Sunday, or the day before a decision.
9 Sept 2026~12 min
The daily check-in: rate the day, write one line, keep going
Rate the day from 1 to 10, write one line about what the number was for, and read the month back instead of your memory of it.
9 Sept 2026~10 min